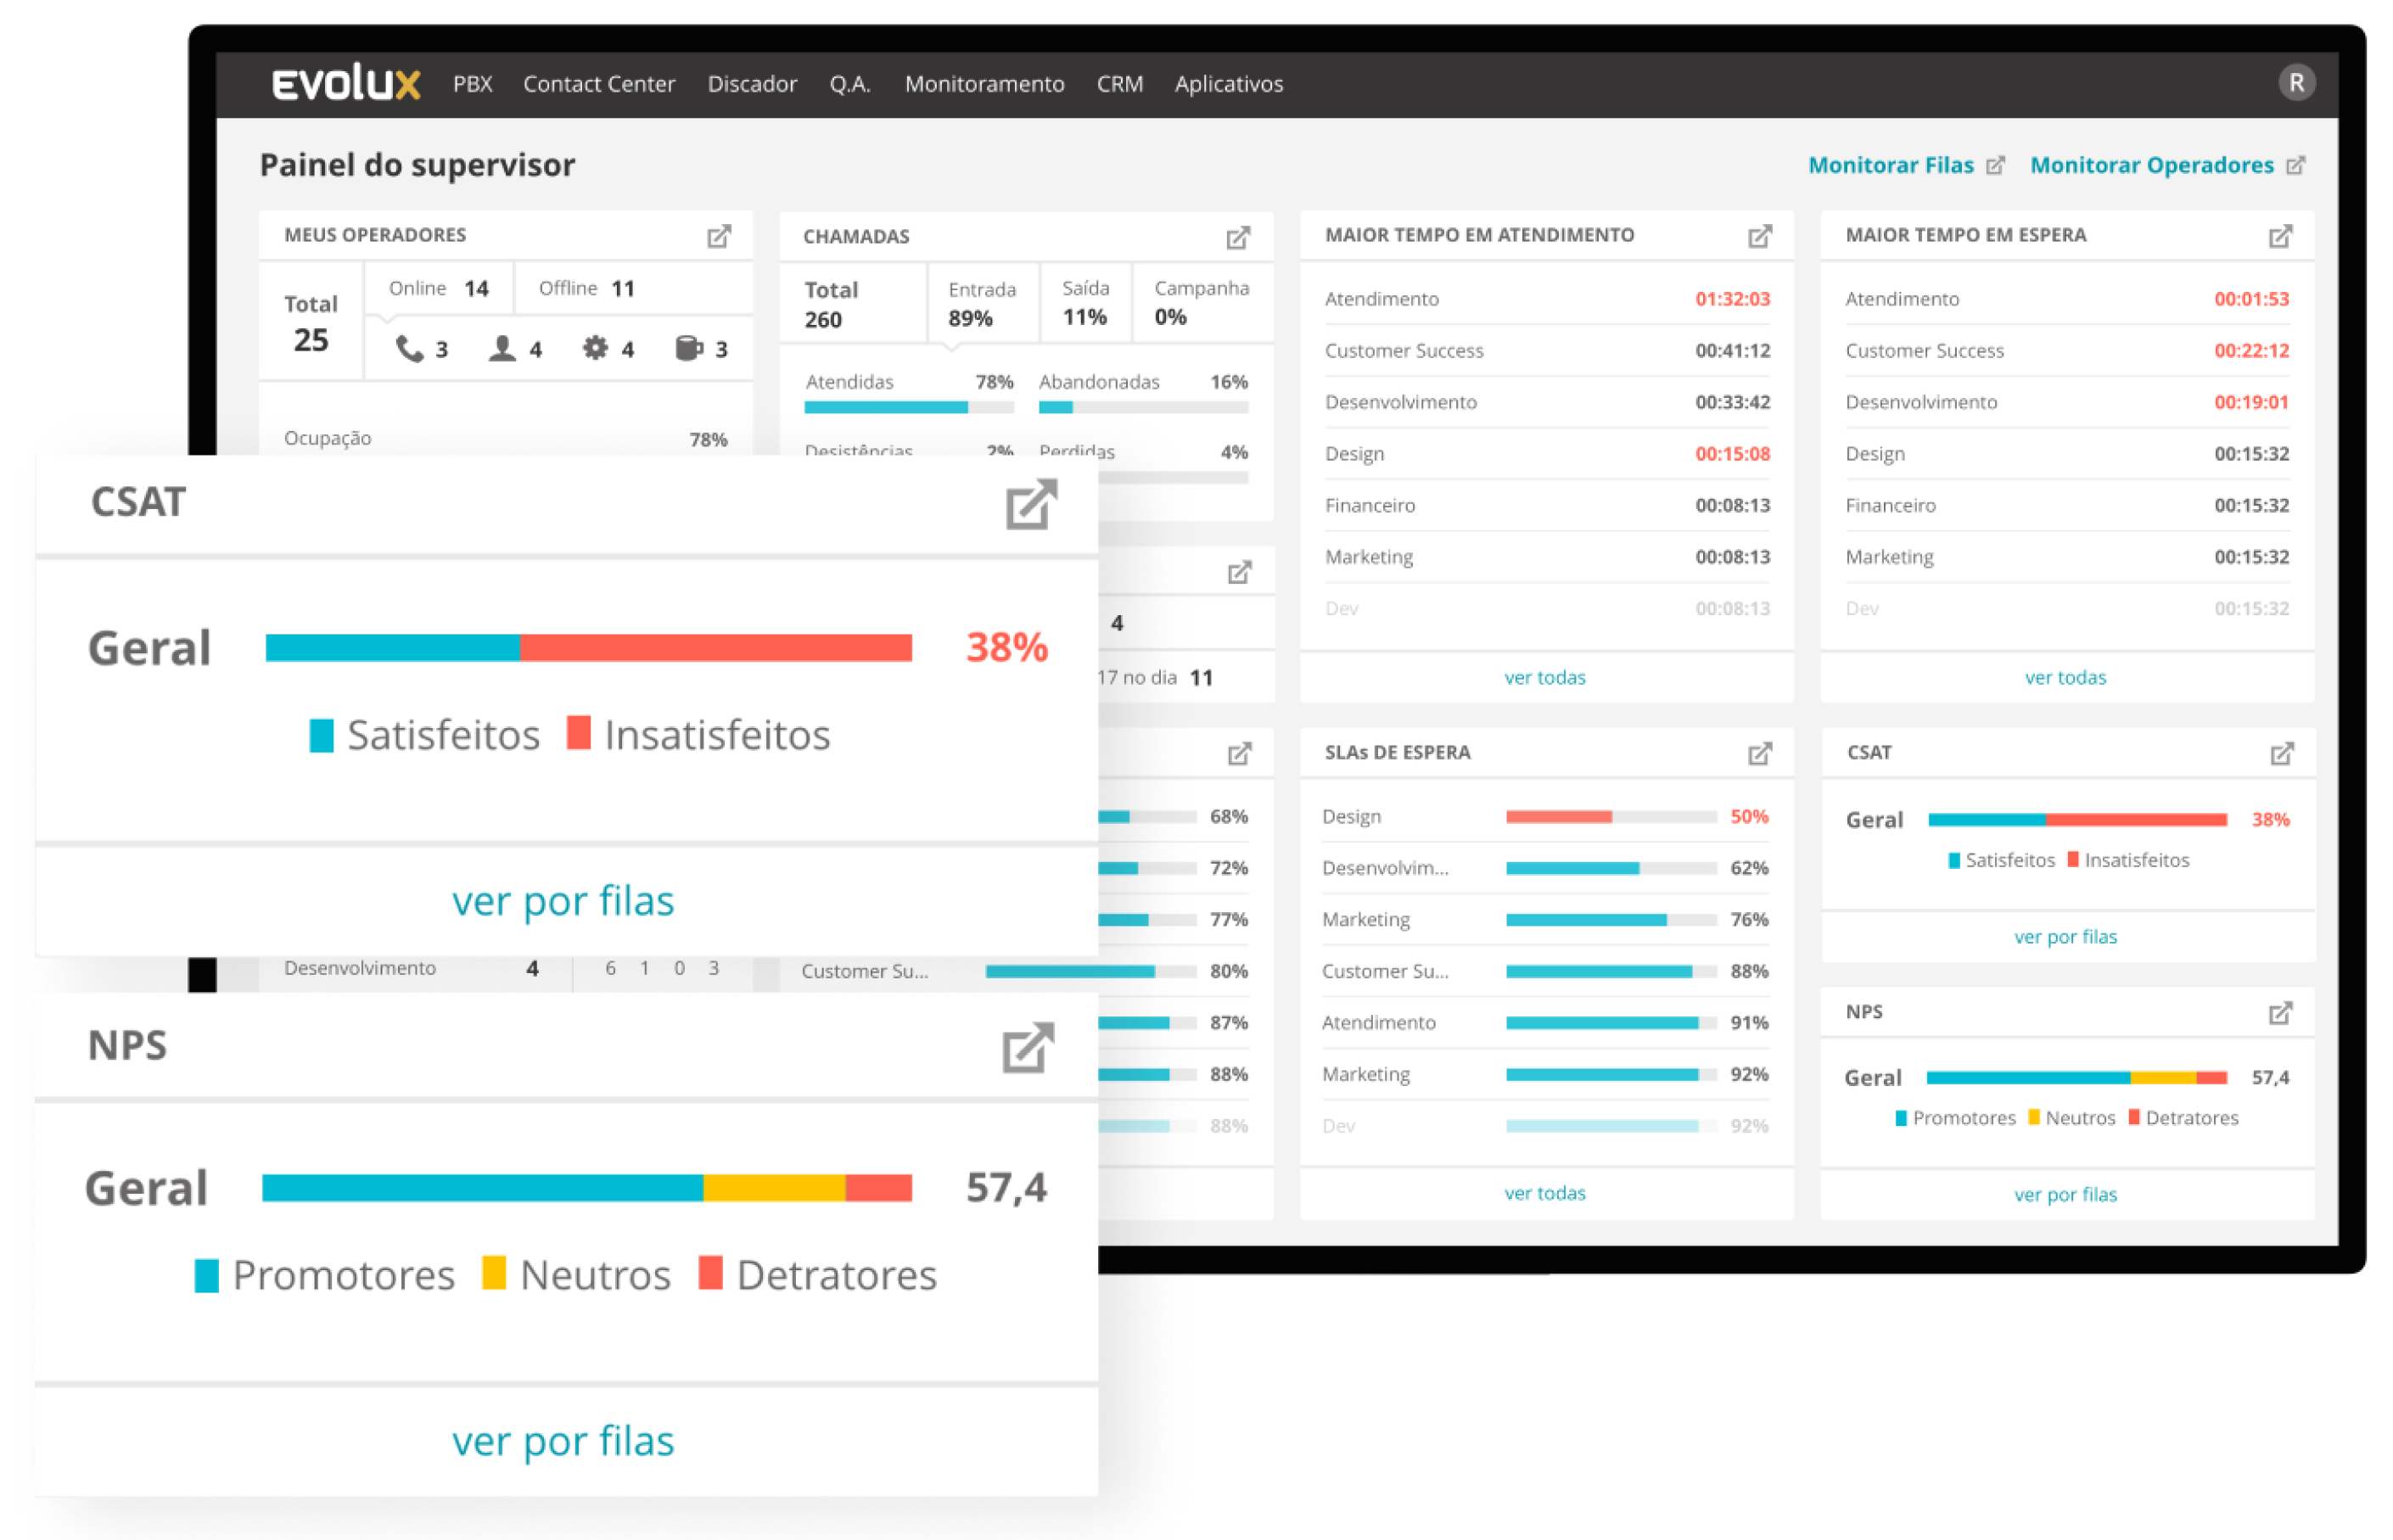
Guiding decisions at a glance


Lead Product Designer responsible for Research, User interviews, Wireframes, and Prototypes.
Evolux
Adobe XD
Evolux is a call center management solution that distributes and records calls and provides real-time reports and dashboards to supervise and analyze operations.
Call center supervisors requested a way to quickly monitor the performance indicators of the operators and the service provided, to guide the decision-making, in order to improve the service throughout the working day.
Initially, we did interviews with supervisors that used the application, to confirm the motivation behind the request. According to users, all indicators needed were already visible in the application, but it was displayed across several pages in detailed reports. During shadowing sessions observing the supervisors, we noticed that they would distribute a few pages on the screen, trying to see everything "at a glance", compromising the data visualization, and increasing the cognitive load, since most data shown was not relevant at that time.
After several follow-up sessions with users and specialists in our team, we've collected and ranked all the relevant indicators to define the hierarchy of data to be displayed in the dashboard.
The final result was a real-time Dashboard divided by focus areas, showing general data of the employees and the service provided, and quick links to the detailed existing pages so that users can easily access the full data if necessary.